Price Per Square Foot Statistics (2026)
The median US home for sale was listed at $222 per square foot in October 2026, according to Realtor.com data published by the St. Louis Fed. That's down 1.3 percent from a year earlier and up 48 percent from October 2019. The house itself costs less than that to build: with the lot left out, the median new for-sale home started in 2025 was $152 per square foot, by NAHB's count.
Last updated November 10, 2026. Every figure links to its source, and the method notes explain why the numbers differ.
- Key statistics
- US average
- By state
- By metro
- Cost to build
- New vs existing
- Rent
- By zip code
- Method
- FAQ
Key statistics
- $222 per square foot is the median US listing price in October 2026, 5 percent below the record $234 set in May 2025 (Realtor.com via FRED).
- $709 in Hawaii, $147 in West Virginia. The most expensive state costs 4.8 times as much per square foot as the cheapest (Realtor.com state data).
- $821 in the San Jose metro, $149 in Cleveland, the top and bottom of the 50 largest metro areas (Realtor.com metro data).
- Up 48 percent since October 2019. Consumer prices rose 31 percent over the same stretch, so the gain after inflation is about 13 percent (our calculation from the Consumer Price Index).
- Prices per square foot fell over the past year in 26 states and Washington, DC, and in 37 of the 50 largest metros. They rose in 22 states and were flat in two.
- Montana is up 87 percent since October 2019, the most of any state. Washington, DC is the only place where the price fell, by 4.5 percent.
- $152 per square foot is the median price of a new for-sale home started in 2025 with the lot taken out; custom homes run $171 (NAHB).
- $162 per square foot is the average construction cost in NAHB's 2024 Construction Cost Survey. The same house sold for $251 per square foot once the lot, overhead and profit were added.
- New homes sold for $205 per square foot and existing homes for $212 in July 2026, so new was cheaper (Zillow).
- $2.08 per square foot per month is the average US apartment rent, based on $1,740 for 835 square feet (RentCafe).
- $33.18 per square foot per year is the average office listing rate, and $9.33 is the average industrial rent (CommercialCafe office and industrial reports).
- $87 per square foot bought a new manufactured home in 2023, about half the $166 for a site-built home without land (Census Bureau table).
Average price per square foot in the US
There isn't one average price per square foot, because each source divides a different price by a different area. The four national figures below run from $152 to $222.
Median listing price per sq ft, October 2026 (Realtor.com).
Median price per sq ft, July 2026 (Zillow).
Median, July 2026 (Zillow).
Median for-sale home started in 2025 (NAHB).
Asking prices per square foot climbed from $127 in July 2016 to a record $234 in May 2025. The figure usually peaks in spring and dips in winter, so compare the same month across years.
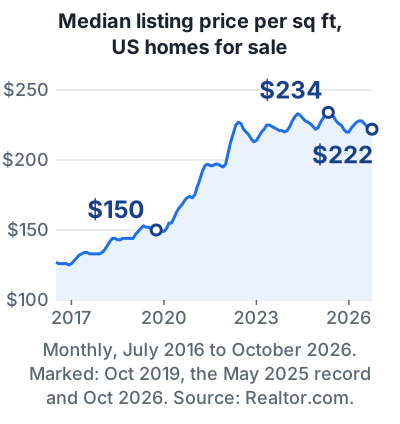
US median listing price per square foot, each October since 2016
| October | Price per sq ft | Change from prior October |
|---|---|---|
| 2016 | $126 | n/a |
| 2017 | $133 | +5.6% |
| 2018 | $144 | +8.3% |
| 2019 | $150 | +4.2% |
| 2020 | $173 | +15.3% |
| 2021 | $197 | +13.9% |
| 2022 | $218 | +10.7% |
| 2023 | $221 | +1.4% |
| 2024 | $226 | +2.3% |
| 2025 | $225 | -0.4% |
| 2026 | $222 | -1.3% |
Most of the rise came in three years. The October figure went from $150 in 2019 to $218 in 2022, and has stayed within 4 percent of that level every October since.
Price per square foot by state
Hawaii is the most expensive state at $709 per square foot and West Virginia the cheapest at $147, in Realtor.com's October 2026 state file. Twenty-three states and Washington, DC sit above the national $222, and 22 states are under $200.
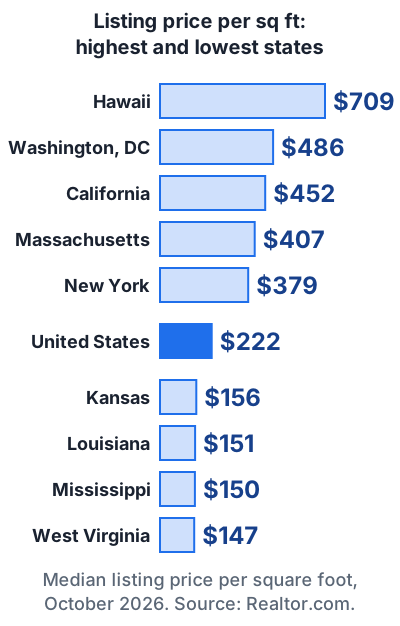
The fastest climbers since 2019 are Montana and northern New England:
$171 to $320 since October 2019.
$168 to $307.
$146 to $267.
$153 to $277.
At the other end, Washington, DC fell 4.5 percent ($509 to $486), and Louisiana rose 29 percent, the smallest gain of any state. The past year was softer: the price fell in 26 states and DC and was flat in Kentucky and Alabama, with New York (down 4.8 percent), Hawaii and Massachusetts (both down 4.2 percent) dropping most.
Price per square foot in all 50 states and DC, October 2026
| Rank | State | Price per sq ft | 1-year change | Change since Oct 2019 | Median listing size | Sq ft per $100,000 |
|---|---|---|---|---|---|---|
| 1 | Hawaii | $709 | -4.2% | +38% | 1,040 sq ft | 141 |
| 2 | District of Columbia | $486 | -1.8% | -5% | 1,236 sq ft | 206 |
| 3 | California | $452 | -1.5% | +40% | 1,717 sq ft | 221 |
| 4 | Massachusetts | $407 | -4.2% | +55% | 1,769 sq ft | 246 |
| 5 | New York | $379 | -4.8% | +68% | 1,559 sq ft | 264 |
| 6 | Rhode Island | $374 | +13.1% | +68% | 1,550 sq ft | 267 |
| 7 | Washington | $337 | -0.7% | +47% | 1,947 sq ft | 297 |
| 8 | Montana | $320 | +1.3% | +87% | 2,120 sq ft | 312 |
| 9 | New Jersey | $311 | -0.8% | +61% | 1,650 sq ft | 322 |
| 10 | New Hampshire | $307 | -0.9% | +83% | 1,912 sq ft | 326 |
| 11 | Oregon | $298 | -2.3% | +37% | 1,867 sq ft | 336 |
| 12 | Idaho | $290 | +1.9% | +71% | 2,179 sq ft | 345 |
| 13 | Connecticut | $279 | +1.5% | +63% | 1,876 sq ft | 358 |
| 14 | Colorado | $278 | -1.7% | +36% | 2,012 sq ft | 360 |
| 15 | Maine | $277 | -1.7% | +81% | 1,680 sq ft | 361 |
| 16 | Vermont | $267 | +0.7% | +83% | 1,940 sq ft | 375 |
| 17 | Nevada | $266 | -2.4% | +48% | 1,824 sq ft | 376 |
| 18 | Alaska | $260 | +3.3% | +58% | 1,727 sq ft | 385 |
| 19 | Arizona | $260 | -2.1% | +49% | 1,854 sq ft | 385 |
| 20 | Utah | $252 | -0.7% | +63% | 2,355 sq ft | 397 |
| 21 | Florida | $250 | -3.5% | +37% | 1,615 sq ft | 400 |
| 22 | Virginia | $232 | +1.2% | +56% | 1,976 sq ft | 431 |
| 23 | Delaware | $228 | -2.1% | +47% | 2,060 sq ft | 439 |
| 24 | Maryland | $227 | -2.9% | +34% | 1,846 sq ft | 441 |
| 25 | Tennessee | $220 | -0.4% | +64% | 1,956 sq ft | 455 |
| 26 | Wisconsin | $216 | +1.0% | +62% | 1,764 sq ft | 463 |
| 27 | New Mexico | $215 | +0.6% | +62% | 1,936 sq ft | 465 |
| 28 | Wyoming | $213 | +2.4% | +73% | 2,266 sq ft | 469 |
| 29 | North Carolina | $212 | -2.2% | +50% | 1,927 sq ft | 472 |
| 30 | South Carolina | $199 | -1.6% | +46% | 1,834 sq ft | 503 |
| 31 | South Dakota | $199 | -3.0% | +64% | 1,864 sq ft | 503 |
| 32 | Minnesota | $195 | -2.2% | +34% | 1,933 sq ft | 513 |
| 33 | Pennsylvania | $188 | -1.4% | +55% | 1,680 sq ft | 532 |
| 34 | Georgia | $187 | -1.1% | +55% | 2,084 sq ft | 535 |
| 35 | Michigan | $186 | +2.7% | +49% | 1,584 sq ft | 538 |
| 36 | Illinois | $185 | +1.1% | +42% | 1,695 sq ft | 541 |
| 37 | Texas | $179 | -2.2% | +37% | 1,996 sq ft | 559 |
| 38 | Kentucky | $174 | 0.0% | +63% | 1,800 sq ft | 575 |
| 39 | Iowa | $173 | +4.0% | +42% | 1,608 sq ft | 578 |
| 40 | North Dakota | $173 | +5.6% | +56% | 2,048 sq ft | 578 |
| 41 | Missouri | $171 | +0.7% | +54% | 1,736 sq ft | 585 |
| 42 | Nebraska | $167 | -0.4% | +45% | 2,112 sq ft | 599 |
| 43 | Ohio | $167 | +1.5% | +67% | 1,711 sq ft | 599 |
| 44 | Arkansas | $166 | +2.2% | +68% | 1,872 sq ft | 602 |
| 45 | Alabama | $165 | 0.0% | +51% | 1,906 sq ft | 606 |
| 46 | Indiana | $162 | +3.8% | +67% | 1,800 sq ft | 617 |
| 47 | Oklahoma | $162 | +0.9% | +54% | 1,848 sq ft | 617 |
| 48 | Kansas | $156 | +4.0% | +64% | 1,947 sq ft | 641 |
| 49 | Louisiana | $151 | -0.4% | +29% | 1,813 sq ft | 662 |
| 50 | Mississippi | $150 | +1.2% | +52% | 1,900 sq ft | 667 |
| 51 | West Virginia | $147 | +2.7% | +58% | 1,773 sq ft | 680 |
The 2019 figures come from each state's Realtor.com series on FRED, such as Montana's. The last column is our own division: $100,000 divided by the price per square foot.
Two rows to read with care. Hawaii's median listing is 1,040 square feet, the smallest of any state and less than half of Utah's 2,355, so the two figures describe very different homes. Rhode Island's 13.1 percent one-year jump is more than double any other state's move (North Dakota is next at 5.6 percent), so treat it as provisional.
Price per square foot by metro area
Among the 50 largest metro areas, San Jose is highest at $821 per square foot and Cleveland lowest at $149, a gap of 5.5 times (Realtor.com, October 2026). The figure below shows what that gap means in floor area.
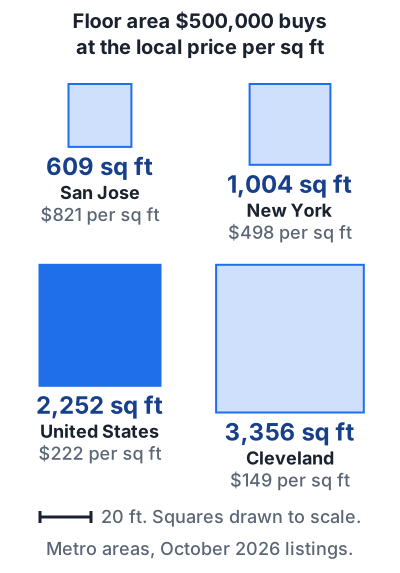
Prices per square foot fell over the past year in 37 of the 50 metros. Austin dropped most, 8.3 percent, followed by Tampa at 5.3 percent. Providence (up 7.7 percent) and Indianapolis (up 5.2 percent) rose most.
Price per square foot in the 50 largest US metro areas, October 2026
| Rank | Metro area | Price per sq ft | 1-year change | Median listing size | Sq ft $500,000 buys |
|---|---|---|---|---|---|
| 1 | San Jose-Sunnyvale-Santa Clara, CA | $821 | -2.1% | 1,617 sq ft | 609 |
| 2 | Los Angeles-Long Beach-Anaheim, CA | $642 | -3.1% | 1,698 sq ft | 779 |
| 3 | San Francisco-Oakland-Fremont, CA | $630 | -3.5% | 1,579 sq ft | 794 |
| 4 | San Diego-Chula Vista-Carlsbad, CA | $583 | -3.7% | 1,523 sq ft | 858 |
| 5 | New York-Newark-Jersey City, NY-NJ | $498 | -1.4% | 1,450 sq ft | 1,004 |
| 6 | Boston-Cambridge-Newton, MA-NH | $454 | -2.7% | 1,734 sq ft | 1,101 |
| 7 | Seattle-Tacoma-Bellevue, WA | $423 | -3.4% | 1,890 sq ft | 1,182 |
| 8 | Miami-Fort Lauderdale-West Palm Beach, FL | $358 | -0.5% | 1,308 sq ft | 1,397 |
| 9 | Providence-Warwick, RI-MA | $357 | +7.7% | 1,618 sq ft | 1,401 |
| 10 | Sacramento-Roseville-Folsom, CA | $338 | -0.3% | 1,780 sq ft | 1,479 |
| 11 | Riverside-San Bernardino-Ontario, CA | $330 | -1.9% | 1,805 sq ft | 1,515 |
| 12 | Portland-Vancouver-Hillsboro, OR-WA | $302 | -2.3% | 1,950 sq ft | 1,656 |
| 13 | Washington-Arlington-Alexandria, DC-VA-MD-WV | $299 | -2.7% | 1,908 sq ft | 1,672 |
| 14 | Denver-Aurora-Centennial, CO | $277 | -3.7% | 2,052 sq ft | 1,805 |
| 15 | Phoenix-Mesa-Chandler, AZ | $264 | -2.1% | 1,904 sq ft | 1,894 |
| 16 | Salt Lake City-Murray, UT | $260 | +0.3% | 2,280 sq ft | 1,923 |
| 17 | Nashville-Davidson-Murfreesboro-Franklin, TN | $259 | -0.9% | 2,145 sq ft | 1,931 |
| 18 | Las Vegas-Henderson-North Las Vegas, NV | $258 | -2.7% | 1,798 sq ft | 1,938 |
| 19 | Hartford-West Hartford-East Hartford, CT | $246 | +2.0% | 1,816 sq ft | 2,033 |
| 20 | Tampa-St. Petersburg-Clearwater, FL | $232 | -5.3% | 1,612 sq ft | 2,155 |
| 21 | Milwaukee-Waukesha, WI | $227 | +2.6% | 1,700 sq ft | 2,203 |
| 22 | Philadelphia-Camden-Wilmington, PA-NJ-DE-MD | $227 | -1.4% | 1,600 sq ft | 2,203 |
| 23 | Austin-Round Rock-San Marcos, TX | $226 | -8.3% | 1,993 sq ft | 2,212 |
| 24 | Richmond, VA | $226 | +0.2% | 2,010 sq ft | 2,212 |
| 25 | Tucson, AZ | $223 | -1.2% | 1,765 sq ft | 2,242 |
| 26 | Orlando-Kissimmee-Sanford, FL | $222 | -2.7% | 1,840 sq ft | 2,252 |
| 27 | Virginia Beach-Chesapeake-Norfolk, VA-NC | $222 | +2.2% | 1,954 sq ft | 2,252 |
| 28 | Chicago-Naperville-Elgin, IL-IN | $219 | +3.7% | 1,732 sq ft | 2,283 |
| 29 | Charlotte-Concord-Gastonia, NC-SC | $216 | -1.6% | 1,975 sq ft | 2,315 |
| 30 | Baltimore-Columbia-Towson, MD | $213 | -2.9% | 1,790 sq ft | 2,347 |
| 31 | Raleigh-Cary, NC | $213 | -3.1% | 2,236 sq ft | 2,347 |
| 32 | Jacksonville, FL | $212 | -1.3% | 1,722 sq ft | 2,358 |
| 33 | Columbus, OH | $205 | +1.0% | 1,737 sq ft | 2,439 |
| 34 | Minneapolis-St. Paul-Bloomington, MN-WI | $204 | -2.6% | 1,954 sq ft | 2,451 |
| 35 | Dallas-Fort Worth-Arlington, TX | $197 | -2.2% | 2,185 sq ft | 2,538 |
| 36 | Kansas City, MO-KS | $194 | +1.8% | 2,066 sq ft | 2,577 |
| 37 | Atlanta-Sandy Springs-Roswell, GA | $193 | -1.2% | 2,203 sq ft | 2,591 |
| 38 | Cincinnati, OH-KY-IN | $189 | -0.6% | 1,761 sq ft | 2,646 |
| 39 | Detroit-Warren-Dearborn, MI | $185 | +3.2% | 1,482 sq ft | 2,703 |
| 40 | Buffalo-Cheektowaga, NY | $184 | +0.1% | 1,496 sq ft | 2,717 |
| 41 | Louisville/Jefferson County, KY-IN | $177 | -0.4% | 1,730 sq ft | 2,825 |
| 42 | Oklahoma City, OK | $170 | +0.4% | 1,886 sq ft | 2,941 |
| 43 | San Antonio-New Braunfels, TX | $169 | -3.7% | 1,948 sq ft | 2,959 |
| 44 | Houston-Pasadena-The Woodlands, TX | $168 | -2.3% | 2,130 sq ft | 2,976 |
| 45 | Pittsburgh, PA | $168 | -1.9% | 1,562 sq ft | 2,976 |
| 46 | Indianapolis-Carmel-Greenwood, IN | $164 | +5.2% | 1,822 sq ft | 3,049 |
| 47 | St. Louis, MO-IL | $163 | -1.7% | 1,642 sq ft | 3,067 |
| 48 | Birmingham, AL | $157 | -1.0% | 1,835 sq ft | 3,185 |
| 49 | Memphis, TN-MS-AR | $152 | -1.8% | 1,888 sq ft | 3,289 |
| 50 | Cleveland, OH | $149 | -0.7% | 1,840 sq ft | 3,356 |
The four California metros at the top all list above $580 per square foot. Houston ($168) and San Antonio ($169) are among the ten cheapest, and Dallas ($197) is well under the national median. To size a specific house against these figures, add up its rooms with the house square footage calculator.
Cost to build a house per square foot
The average cost to build a house was $162 per square foot in NAHB's 2024 Construction Cost Survey, the latest edition. That's $428,215 of construction on a 2,647 square foot home, with no land in the figure. The survey had usable answers from only 41 builders, so read it as a guide, not a national average.
NAHB's larger study of Census data gives medians for homes started in 2025, also without the lot:
Median per sq ft, against $153 for 2024 starts.
Median contract price per sq ft.
The widest gap since 2011.
Construction cost per square foot by stage
Interior finishes are the biggest single stage at about $39 per square foot, ahead of the mechanical systems at $31. We divided each stage in the NAHB survey by the 2,647 square foot average home.
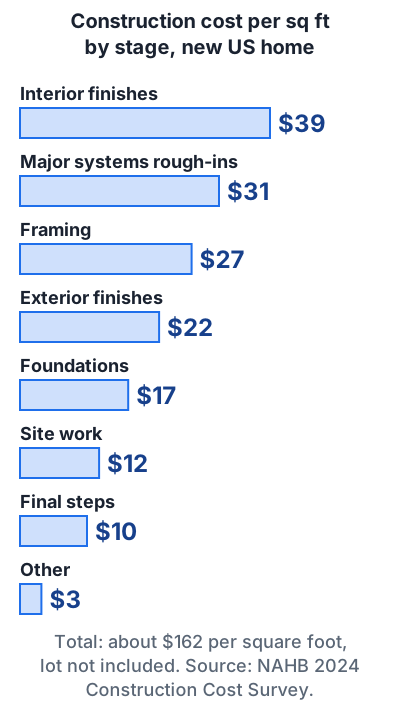
From $162 to build to $251 to buy
The same average home sold for $665,298, or $251 per square foot. Construction was 64.4 percent of that price. The rest, also divided by 2,647 square feet:
| Part of the sale price | Per sq ft | Share of price |
|---|---|---|
| Construction | $162 | 64.4% |
| Finished lot | $34 | 13.7% |
| Builder profit | $28 | 11.0% |
| Overhead and general expenses | $14 | 5.7% |
| Sales commission | $7 | 2.8% |
| Financing | $4 | 1.5% |
| Marketing | $2 | 0.8% |
| Sale price | $251 | 100% |
Rules sit inside several of those lines. NAHB estimates that government regulation accounts for 26.4 percent of a new home's price in 2026, or $131,734 on an average home.
Cost to build by region
Where you build moves the figure a long way. For for-sale homes started in 2025, NAHB reports these medians before the lot:
The highest division.
Custom homes there run $171.
Above the national median.
New York, New Jersey and Pennsylvania.
The lowest; Kentucky, Tennessee, Alabama and Mississippi.
The lot is a separate bill. The median lot under a new for-sale detached home was valued at $59,000 in 2025, from $50,000 in the South Atlantic and East South Central divisions to $171,000 on the Pacific coast. See average lot size for what that buys in land.
How building costs have changed
New homes cost about 72 percent more per square foot in 2025 than in 2015. Census figures for new homes sold, with the land value removed, went from $100.02 per square foot in 2015 to $165.94 in 2023, and LendingTree's analysis of the 2025 Census data puts 2025 at $171.95. In 1995 the figure was $62.45.
Average price per square foot of new homes sold, land excluded, 2014 to 2025
| Year | New site-built home | New manufactured home |
|---|---|---|
| 2014 | $97.25 | $45.41 |
| 2015 | $100.02 | $47.55 |
| 2016 | $105.06 | $48.82 |
| 2017 | $111.05 | $50.42 |
| 2018 | $114.43 | $54.59 |
| 2019 | $118.91 | $56.56 |
| 2020 | $123.45 | $59.14 |
| 2021 | $144.89 | $72.21 |
| 2022 | $167.48 | $87.79 |
| 2023 | $165.94 | $86.62 |
| 2025 | $171.95 | not available |
Census Bureau figures for 2014 to 2023; 2025 from LendingTree's analysis of Census data. We could not confirm a 2024 figure.
A factory-built home costs about half as much per square foot. The average new manufactured home sold for $124,300 in 2023 and measured 1,435 square feet, which is $86.62 per square foot, against $165.94 for a site-built home.
New homes vs existing homes
New homes now cost less per square foot than existing ones. Zillow's September 2026 analysis put the median new home at $205 per square foot in July 2026 and the median existing home at $212, a gap of $7 or about 3.3 percent.
That reverses the usual order. New homes sold at a premium in 77 of the 84 months from 2018 to 2024, and the premium peaked at $25 per square foot in November 2022.
Of the major metros Zillow tracks.
Austin: $184 new, $228 existing.
New York: $727 new, $441 existing.
New homes are also concentrated in lower-priced markets. In the same Zillow data they made up 37.1 percent of sales in San Antonio and 33.6 percent in Raleigh over the year to July 2026, against 3.2 percent in New York. For a second read on new homes, the Census Bureau's median new home sold in 2025 was 2,194 square feet at a median price of $417,400, which works out to roughly $190 per square foot with the lot (our division of the two medians). For sizes, see average square footage of a house.
Rent per square foot
The average US apartment rents for about $2.08 per square foot per month. That's our division of the national average rent of $1,740 by the average apartment size of 835 square feet, both from RentCafe's July 2026 report on buildings with 50 or more units (Yardi Matrix data for March 2026).
National average.
About $7.14 per sq ft a month.
About $1.09 per sq ft a month.
Commercial space is quoted per square foot per year, so the chart puts apartments on the same yearly basis: $2.08 a month is about $25 a year.
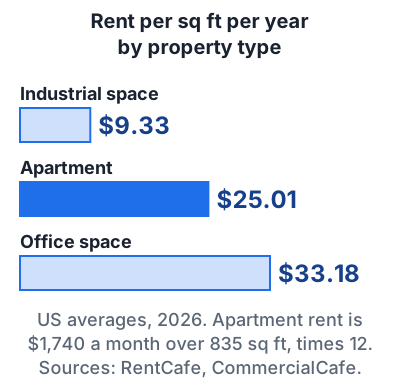
Office space listed at an average of $33.18 per square foot in September 2026, up 1.2 percent in a year, and industrial space rented for $9.33, up 5.3 percent.
Commercial rent and sale price per square foot, September 2026
| Measure | Office | Industrial |
|---|---|---|
| Average rent per sq ft per year | $33.18 (listing rate) | $9.33 (in-place rent) |
| Change in a year | +1.2% | +5.3% |
| Newest leases | n/a | $10.13 |
| Highest market cited | Manhattan, a little over $72 | Miami, $14.18 |
| Lowest market cited | Detroit, $20.86 | Columbus, $5.93 |
| Vacancy rate | 17.8% | 9.7% |
| Average sale price per sq ft, 2026 to date | $197 | $140 |
Office rates by class: Class A $40.62, Class B $27.07, Class C $19.63. Source: CommercialCafe national office and industrial reports, October 2026.
Office buildings sold for an average of $197 per square foot in 2026 and industrial buildings for $140, both below the $222 asked for the median home. Commercial rent is billed on rentable area, which is bigger than the space you occupy; commercial square footage explains the difference, and average apartment size covers unit sizes by type.
Price per square foot by zip code
The tables above stop at the metro level, but you can look up the listing price per square foot for a single zip code in a few minutes.
- Open Realtor.com's zip code file. Its monthly inventory data by zip code has a median listing price per square foot column. It's a large CSV, so open it in a spreadsheet and filter to your zip.
- Check the county. FRED carries the same Realtor.com series for states, metro areas and counties. Search for "median listing price per square feet" plus the county name.
- Work out recent sales yourself. Divide each sold price by the home's finished square feet. Three to five sales of similar homes nearby tell you more than any zip code median.
The price per square foot calculator page has worked examples for homes, projects and rent.
How these numbers are measured
Price per square foot is a price divided by an area, and both halves change from source to source. That's why a new home can be $152, $162, $205 or $251 per square foot in the same year.
| Figure | Price used | Area used | Period |
|---|---|---|---|
| $222, Realtor.com | Median asking price of active listings | Square feet in the listing | October 2026 |
| $212 and $205, Zillow | Median price of existing and new homes | Not stated in the release | July 2026 |
| $152 and $171, NAHB | Sale or contract price without the lot | Finished floor area | Homes started in 2025 |
| $162, NAHB survey | Builder's construction cost | Finished floor area | 2024 |
| $171.95, Census | Average sale price minus land value | Finished floor area | Homes sold in 2025 |
| $2.08 a month, RentCafe | Average rent | Average unit size | March 2026 |
Three things to keep in mind when you compare any two figures:
- Listing prices are not sale prices. The Realtor.com figures are what sellers ask. Realtor.com changed its method in November 2021 and September 2022 and restated its history, according to the series notes on FRED. Its files are replaced each month, so the linked files will show newer months over time.
- The area is not measured the same way. The Census Bureau counts all finished floor space, basements and attics included, measured from the outside of the walls, and leaves out garages and unfinished space. Listings follow local practice, and appraisers report below-grade space apart from the main total under ANSI Z765. See what counts as square footage and whether a basement counts.
- Medians and averages differ. A few very expensive homes pull an average up but barely move a median, so averages usually run higher.
Our own calculations are marked as such: the change since October 2019, the square feet $100,000 or $500,000 buys, the inflation adjustment (CPI for all urban consumers, October 2019 to September 2026), the per square foot split of NAHB's cost survey, and apartment rent per square foot. To measure a home yourself, start with how to calculate square footage.
Frequently asked questions
What is the average price per square foot for a house in the US?
The median listing price was $222 per square foot in October 2026. Homes that actually sold went for a median of $212 per square foot (existing) and $205 (new) in July 2026.
What is the average cost to build a house per square foot?
About $162 per square foot for construction alone, in NAHB's 2024 survey. The median new for-sale home started in 2025 was $152 per square foot before the lot, and custom homes were $171.
Which state has the highest price per square foot?
Hawaii, at $709 per square foot in October 2026. Washington, DC ($486), California ($452), Massachusetts ($407) and New York ($379) follow.
Which state has the lowest price per square foot?
West Virginia, at $147 per square foot in October 2026, just under Mississippi ($150) and Louisiana ($151).
Is the price per square foot going down?
Slightly. The US median listing price per square foot fell 1.3 percent in the year to October 2026 and is 5 percent below its May 2025 record. It's still 48 percent higher than in October 2019.
Is it cheaper per square foot to build or buy?
Per square foot of house alone, building is cheaper: $152 to $171 against $212 for an existing home. Add the lot and the builder's other costs and a new home sold for $205 per square foot in July 2026, $7 less than an existing one.
What is the average rent per square foot?
About $2.08 per square foot per month for a US apartment, or roughly $25 a year. Offices list at $33.18 per square foot per year and industrial space rents for $9.33.
What is a good price per square foot?
One at or below what similar homes nearby sold for. National and state medians only tell you whether a market is expensive; they can't price a single house.